


Ask an Attorney a Question for FREE!
Accident Diagram
The best way to describe exactly what happened
Being able to produce a good accident diagram can help you document your claim.
90% of the claims that I took to arbitration I won because of my diagrams. You do not have to be an expert to have a well drawn accident diagram. You simply need to adequately convey the idea of what happened. Cars can simply be represented as “boxes”.
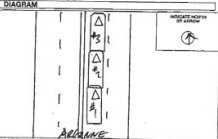
This is what a police officer’s diagram looks like:
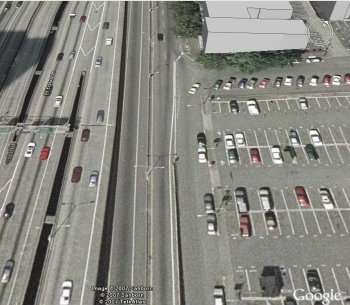
I suggest you visit Google Earth. First look at a satellite picture of the accident scene. If you were involved in a parking lot accident, then this step is essential.
A good Google Earth picture can show you the lanes of travel, buildings, visibility issues, lights, etc. Here is an example:
If you decide to work with a Google Earth picture when creating your accident diagram, then attach this picture to your diagram. It will show that you have researched the area.
The person looking at your diagram will see that you are not just drawing any street; you are drawing the actual scene of the accident.
I had couple of insureds print the Google picture and then draw on top of it. If this works for you and it conveys your version of events clearly, then go for it.
Before you submit the accident diagram, make sure a third person looks at it and understands what you are trying to convey.
I had some clients do great diagrams, but they would paint the vehicles on the wrong side of the road. A silly mistake perhaps, but I knew I could not present the diagram to the arbitration panel.
I believe if you have any computer skills, then the best thing to do is to create a diagram right in your computer. You only need Microsoft Word and/or Paint. Most PCs have these programs.
That is all I do when I draw diagrams (I was the only adjuster that did this! Most of my coworkers would do them by hand). Using a computer will allow you to email the diagram easily, have color, and represent movement (by fading vehicles). It looks a lot more professional.
Do not worry if you cannot draw very well. The work is already done for you!
Below you will find my templates for all the most common accidents. You can download these and then draw one yourself.
Here are two sample templates:
The creation of a good accident diagram could take some time.
I have uploaded some generic diagrams that I believe are the most common. You could use them as templates to save some time handling your own claim.
I would say that a good diagram could tilt an indecisive adjuster, jury, judge, or arbitration panel to rule in your favor.
You will need to download two different files. The first one is Accident Diagrams Tools which is where you will find vehicles, arrows, traffic sings, etc. Click here to download
The Second is the basic scene (intersections, four lane highway, two lane road etc.)
The idea is that you copy and paste the vehicles into the scene recreating the facts of the accident.
| Accident Diagram Templates | ||||||
| Accident Diagrams Tools | ||||||
| One Lane | Two Lanes | Three Lanes | Four lanes | Five Lanes | Intersections | Parking Lots |
| North | North | North | North | 4 lanes | Square Stalls | |
| South | South | South | South | 8 lanes | V- Shape Stall 1 lane | |
| East | East | East | East | V- Shape Stall 2 lanes | ||
| West | West | West | West | |||
| 1 North and 1 South | 2 North and 2 South | 2 North, 2 south, and 1 center lane | ||||
| 1 East and 1 West | 2 East and 2 West | 2 East, 2 West, and 1 center lane | ||||
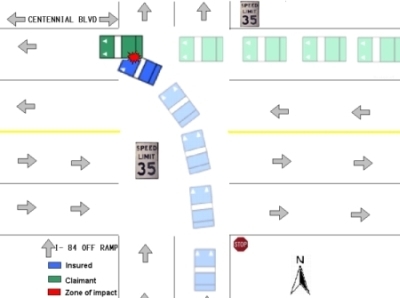
Diagramming tips:
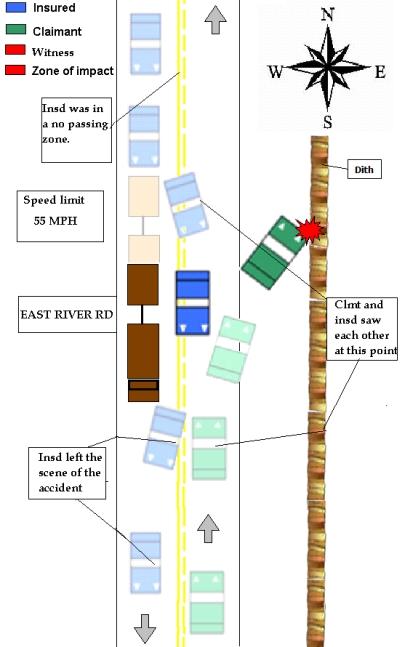
1. After you have the scene and the diagram template opened (two Microsoft Word Files), you want to start your diagram from the point of impact and work backwards. The solid blue or green vehicles represent “the point of impact time frame.”
Add a red star to symbolize the impact on both vehicles.
2. Work backwards from the point of impact with the vehicles that are faded (faded blue, green, and brown). This way you create the illusion of a time sequence.
3. Add all the traffic signals and speed limits, and do not forget the names of the streets.
4. Finally, add text boxes and explain where each driver saw each other and what kind of reactive action they took.
5. You can print the diagram or email it to your adjuster.
Bodily Injury eBook
Traffic ticket eBook
Total Loss eBook
1. Recorded Statement
2. Police Report
3. Overlay Sheet (Interpretation of Police Reports)
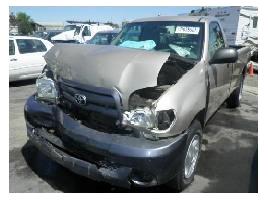
4. Accident Photos
5. Accident Diagrams
6. Accident Videos
7. Vehicle Damage Estimate
8. Length of Time of the Auto Insurance Claim
Find a Qualified Attorney in Your City
|
For a Free Review of Your Case
Please Call (866) 878-2432 |
Auto Insurance Claims Home | Auto Claim Questions | Free Newsletter |
Best Insurance Carriers |
About Agents |
Claim vs Rate |
Accident Photos | Calculate Pain and Suffering | Calculate Pain and Suffering Settlements |
Driving Tips |
Claim Blog |
Auto Claim Forum |
Find a Lawyer |
Attorney Directory |
Site Policies |
Your Host |
Contact Us |
Sitemap |
Quiroga Law Office, PLLC
505 N. Argonne Rd.,
Suite B-109
Spokane Valley, WA 99212